China Solar Exports 2026: Cells, Modules & Trade Trends
Solar export data
Explore cells and modules separately
Compare monthly export values and destination countries in the published product data.
China's solar export figures tell different stories for finished modules and unassembled cells. In July 2026, ChinaData's published customs data records $1.874 billion of module exports, down 1.7% year on year, and $260.9 million of cell exports, down 17.8%. Both declined from June, but January–July export values remained above the same period of 2025.
Data through July 2026 · Reviewed September 20, 2026. This analysis uses the published data behind ChinaData's solar panel export page and solar cell export page. The figures below are a dated snapshot; those product pages carry the current available release.
China solar exports: the latest comparable month
| Export measure | Modules / panels | Unassembled cells |
|---|---|---|
| July 2026 value | $1,873.7 million | $260.9 million |
| July 2025 value | $1,906.3 million | $317.3 million |
| Year-on-year change | −1.7% | −17.8% |
| Change from June 2026 | −12.8% | −23.1% |
| January–July 2026 value | $15.07 billion | $3.52 billion |
| January–July year-on-year change | +12.1% | +71.3% |
A weaker July and a stronger year to date can coexist. Both series reached their highest monthly value in the January 2025–July 2026 window in March 2026. Comparing July only with that peak would answer a different question from comparing July with the same month a year earlier.
These are export values in US dollars. They do not establish that physical shipments, installed capacity or module prices fell by the same percentages. The published snapshot used here ends in July, so it cannot establish an August decline or a sequence of declines extending into August.
Monthly export value: cells and modules
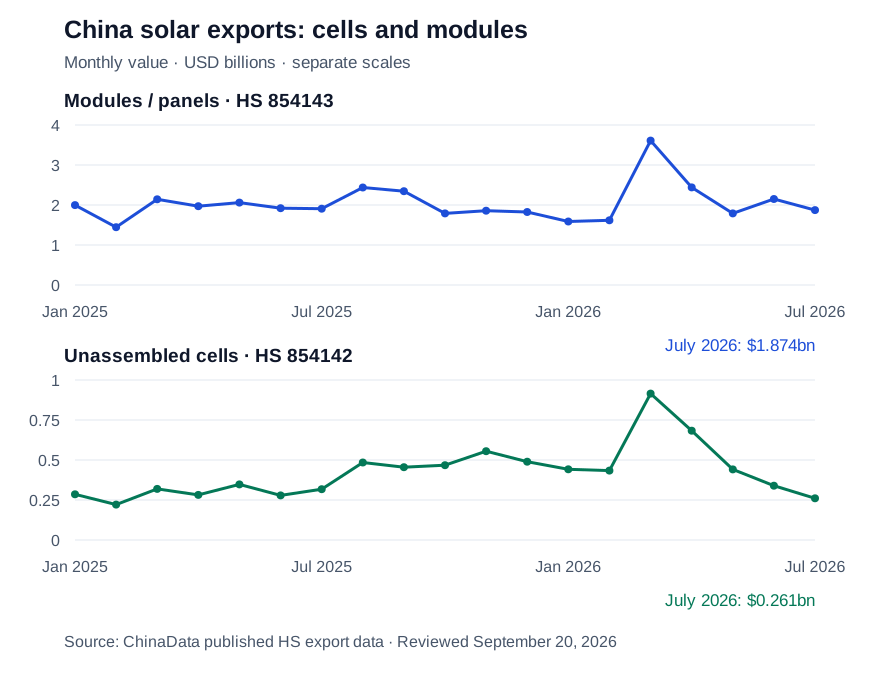
The panels share a time axis but use separate value scales so the smaller cell series remains readable. Source: ChinaData's published HS 854143 and HS 854142 export data. Download the chart.
Monthly values behind the chart
| Month | Modules, USD million | Cells, USD million |
|---|---|---|
| 2025-01 | 1,997.6 | 285.4 |
| 2025-02 | 1,444.3 | 221.5 |
| 2025-03 | 2,143.4 | 319.5 |
| 2025-04 | 1,969.4 | 282.0 |
| 2025-05 | 2,059.7 | 347.3 |
| 2025-06 | 1,919.4 | 278.5 |
| 2025-07 | 1,906.3 | 317.3 |
| 2025-08 | 2,437.8 | 484.1 |
| 2025-09 | 2,344.1 | 455.1 |
| 2025-10 | 1,790.4 | 467.3 |
| 2025-11 | 1,857.3 | 555.0 |
| 2025-12 | 1,825.2 | 489.3 |
| 2026-01 | 1,587.1 | 441.8 |
| 2026-02 | 1,617.5 | 433.8 |
| 2026-03 | 3,611.0 | 914.9 |
| 2026-04 | 2,441.2 | 683.0 |
| 2026-05 | 1,788.8 | 441.5 |
| 2026-06 | 2,149.2 | 339.4 |
| 2026-07 | 1,873.7 | 260.9 |
Solar cells versus modules: choose the right series
| Product | What the ChinaData page covers | Open the data |
|---|---|---|
| Modules / panels | Photovoltaic cells assembled into modules or panels | HS 854143 exports |
| Unassembled cells | Photovoltaic cells not assembled into modules or panels | HS 854142 exports |
Use the module series for finished panel exports and the cell series for unassembled photovoltaic cells. Keeping them separate avoids treating an upstream component and a finished module as interchangeable units. Neither series describes all equipment used in a solar installation.
For domestic output, use China solar cell production. Production, customs exports and installed solar capacity measure different stages of the industry. The solar industry overview provides the broader context.
China PV module exports by country
The leading destinations also differ between the two products. These rankings use July 2026 only, from each product's latest-month partner table. They are not year-to-date or all-history rankings.
| Rank | Module destination | July value, USD million | Cell destination | July value, USD million |
|---|---|---|---|---|
| 1 | Netherlands | 336.0 | United States | 39.9 |
| 2 | Pakistan | 97.0 | Indonesia | 36.4 |
| 3 | Brazil | 85.2 | Kenya | 31.7 |
| 4 | Saudi Arabia | 78.4 | Nigeria | 29.8 |
| 5 | Slovenia | 71.1 | Philippines | 28.2 |
The Netherlands leads the module table, while the United States leads the cell table for this month. A combined ranking would hide that distinction. Recorded destinations also do not identify where a product is ultimately installed or consumed.
Open module exports by country or cell exports by country to explore the published partner previews. Check the selected period: a total across all available months is not a latest-month result. Identifying which destinations drove a year-on-year decline requires matching partner values for July in both years; a current top-five ranking alone cannot answer that question.
Weight, units, value and implied unit value
| Measure | Available in this analysis? | How to interpret it |
|---|---|---|
| Export value | Yes, monthly USD | Customs-recorded value for each product |
| Export weight | Not available in this snapshot | Requires a consistent weight field and unit |
| Export units | Not available in this snapshot | Requires a non-missing quantity and its declared unit |
| Implied unit value | Not calculated | Value divided by a compatible weight or quantity |
The monthly quantity fields in this release are empty. Missing quantities are not zero, and a value-only series cannot produce a shipment count or a price chart.
When compatible quantity data is available, USD/kg means export value divided by weight in kilograms; USD/unit means value divided by the declared unit count. Both are average unit values affected by product mix. Neither is automatically a module market price, and USD/W requires an independently available wattage measure. Calculate these measures separately for cells and modules.
Sources and calculation notes
All figures in this article come from ChinaData's own published GACC-derived product data for HS 854143 and HS 854142, using the release reviewed on September 20, 2026. The chart covers January 2025–July 2026; the summary compares July 2026 with July 2025 and June 2026. The year-to-date comparison uses January–July in both years.
Monthly totals use the full product aggregate, not a sum of the displayed partner preview. Growth is calculated from unrounded USD values as (current / comparison − 1) × 100; displayed amounts and growth rates are rounded separately. The country table uses the release's latest-month rankings.
This snapshot describes the observed movement in export value. It does not identify the effect of a tax-policy change, isolate price from product mix, or measure overseas installation demand.
For methodology, see how to read China HS trade data. For programmatic access, use the API documentation. To request a scoped file with available partner-month rows or quantity fields, use custom China trade data.
Suggested citation: China Data Portal, “China Solar Exports 2026: Cells, Modules & Trade Trends,” data through July 2026, reviewed September 20, 2026.