China Ship Exports by Vessel Type: Tankers & Cargo
Vessel customs data
Explore tanker and cargo-vessel exports
Compare the exact tariff scope and destination before relating USD values to reported vessel counts.
Container vessel exports
One published capacity slice.
Shipbuilding dataset
Manufacturing context, separate from customs exports.
API documentation
Use the public JSON endpoints behind the charts and tables.
China AI, Semiconductors & Advanced Manufacturing Data
Current monthly industry trade figures, commodities and destination research.
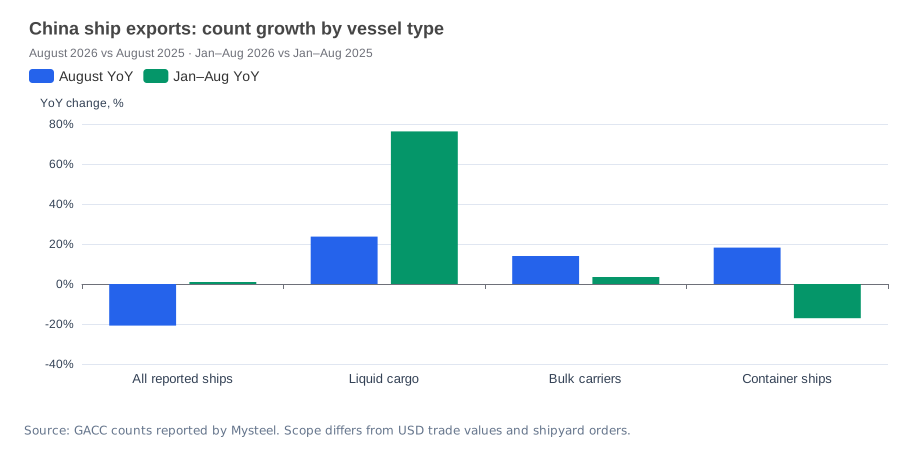
China's reported ship export count fell 20.8% year on year in August 2026, while liquid-cargo-vessel exports increased. The total conceals different vessel-type trends: tanker/liquid-cargo counts strengthened, while container ships' January–August count remained lower than a year earlier.
Reviewed October 2, 2026 · Customs count edition: August 2026. The counts are GACC statistics reported by Mysteel. Use the HS89 ships category and narrower product pages to investigate trade values and destinations; customs exports and shipyard order books describe different events.
China ship exports by vessel type
| Reported grouping | August vessels | August YoY | January–August vessels | January–August YoY |
|---|---|---|---|---|
| All ships, reported total | 487 | −20.8% | 4,529 | +1.0% |
| Liquid-cargo vessels | 47 | +23.7% | 342 | +76.3% |
| Bulk carriers | 49 | +14.0% | 354 | +3.5% |
| Container ships | 13 | +18.2% | 92 | −17.1% |
Source: Mysteel's September 18 and October 1 ship-export reporting. The three selected types do not exhaust the reported total. A positive August change for container ships does not contradict a negative cumulative change: they compare different periods.
Open the full-size vessel-mix chart.
Match vessel types to published customs lines
| Data destination | Scope to check |
|---|---|
| HS6 890120 exports | Tankers; compare its full definition with the reported liquid-cargo grouping |
| HS6 890190 exports | Broader other cargo vessels, including multiple types |
| HS8 89019021 exports | Motor container vessels at or below the stated capacity threshold |
| HS8 89019022 exports | Motor container vessels above that threshold |
| HS8 89019041 exports | A published bulk-carrier capacity slice, not every bulk carrier |
Do not relabel HS 890190 as container ships or treat one capacity slice as the entire bulk-carrier market. HS 8901 transport vessels and the reported all-ship total also need a scope reconciliation before comparing their levels.
Counts, values and implied value per vessel
A study of export mix needs both the physical count and USD value for the same tariff scope, flow and period. Divide value by count only when the count is available, positive and measured in vessels. The resulting implied unit value reflects the vessel mix, size and contract structure; it is not a ship price index.
The inspected HS4/HS6 aggregates have missing monthly quantities; some narrower HS8 lines publish native quantities. Check their units and capacity definitions before calculating a per-vessel value. This edition does not construct an aggregate unit-value series or equate a reported count decline with a value decline. Destination records may reflect registration or delivery arrangements and should not automatically be labelled final operating markets.
Connect trade with manufacturing research
The Advanced Manufacturing Hub connects selected shipbuilding products with machinery research. China shipbuilding data gives production context; output, newly signed orders, outstanding orders and customs exports must remain separate indicators.
For a type-by-country comparison, request a vessel trade extract with the capacity/classification scope, counts and USD values stated explicitly. See API documentation for data access.
Frequently asked questions
Does the August headline show a decline in every ship type? No; the reported type counts moved in different directions.
Can I sum chapter, tanker and container values? A parent heading includes its children. Select non-overlapping leaf categories before building a total.
Source credits: GACC statistics reported by Mysteel on September 18 and October 1, 2026; scraper-synced official HS catalogs for classifications. This edition reports customs counts, not new shipbuilding orders.